Run the reports
Both reports are under Inventory > Reporting.
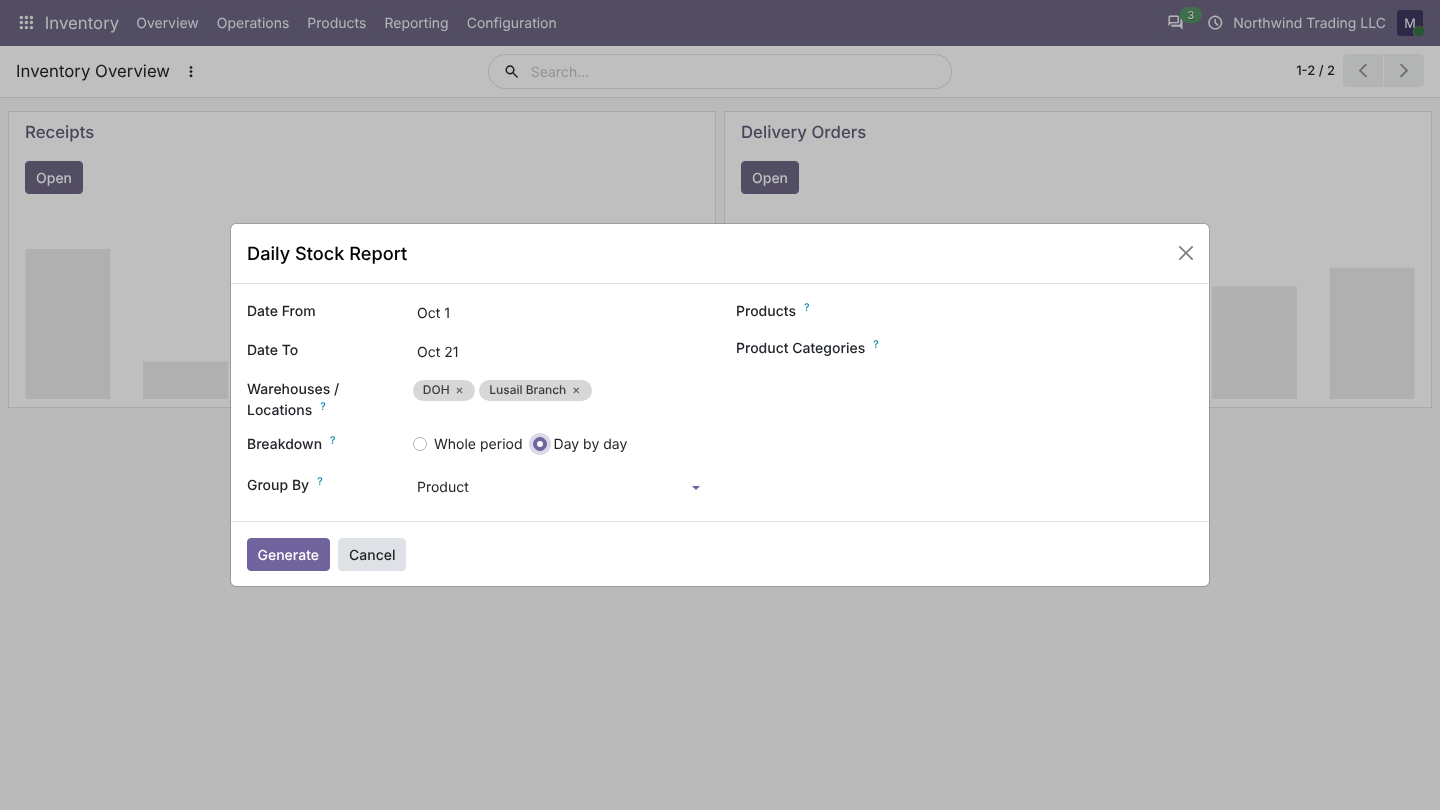
Daily Stock Report
- Open Inventory > Reporting > Daily Stock Report.
- Choose the dates, the warehouses or locations, and optionally products or categories.
- Click Generate.
Each product gets one line with: opening stock, from vendors, customer returns, to customers, vendor returns, adjustments (scrap included), transfers in and out, manufacturing (finished goods and consumed components) and closing stock, with totals. Products that sold out during the period are still listed.
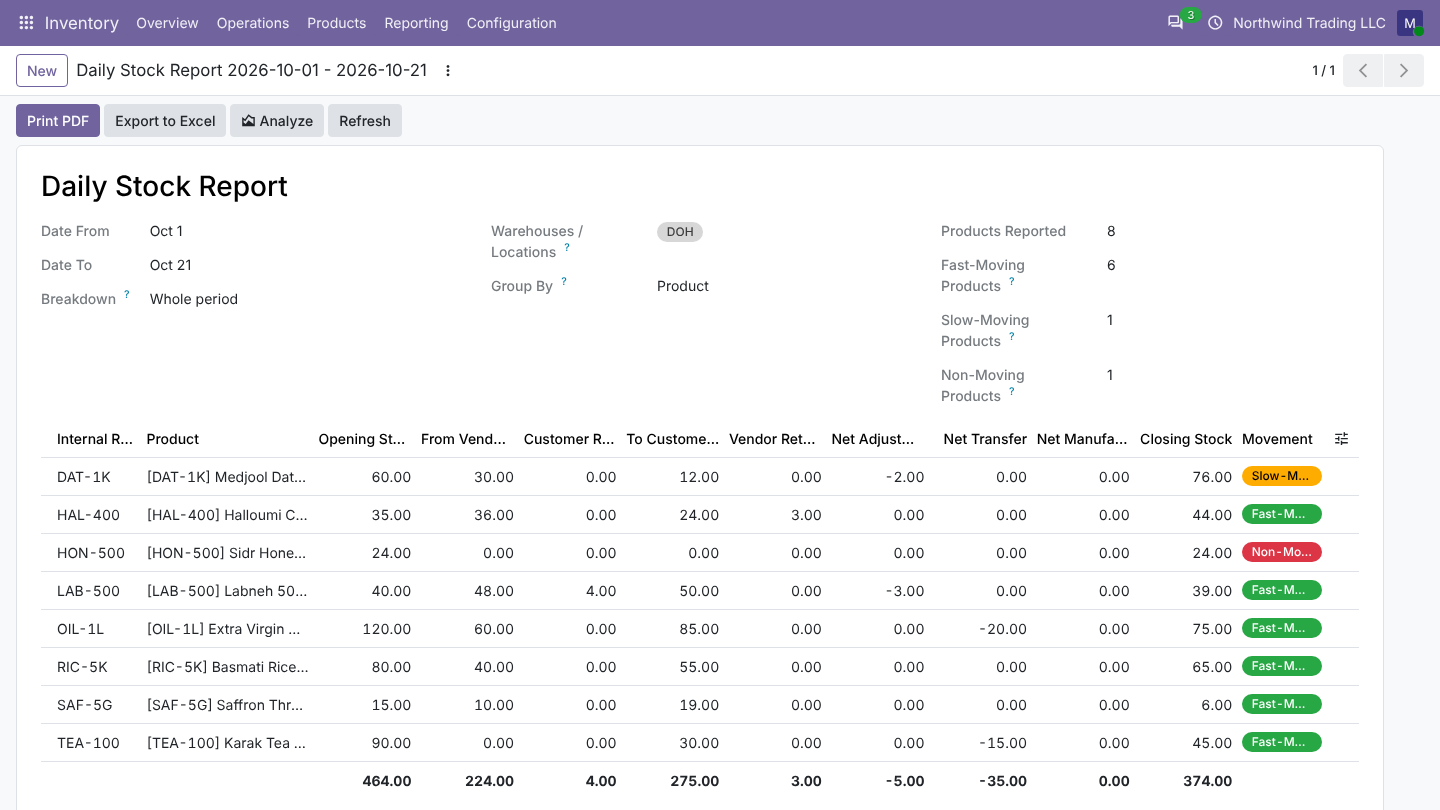
A warehouse covers its stock, input, output and packing zones, so multi-step deliveries count as sales. Pick a single location (for example a shelf) to report only on it.
Day by day
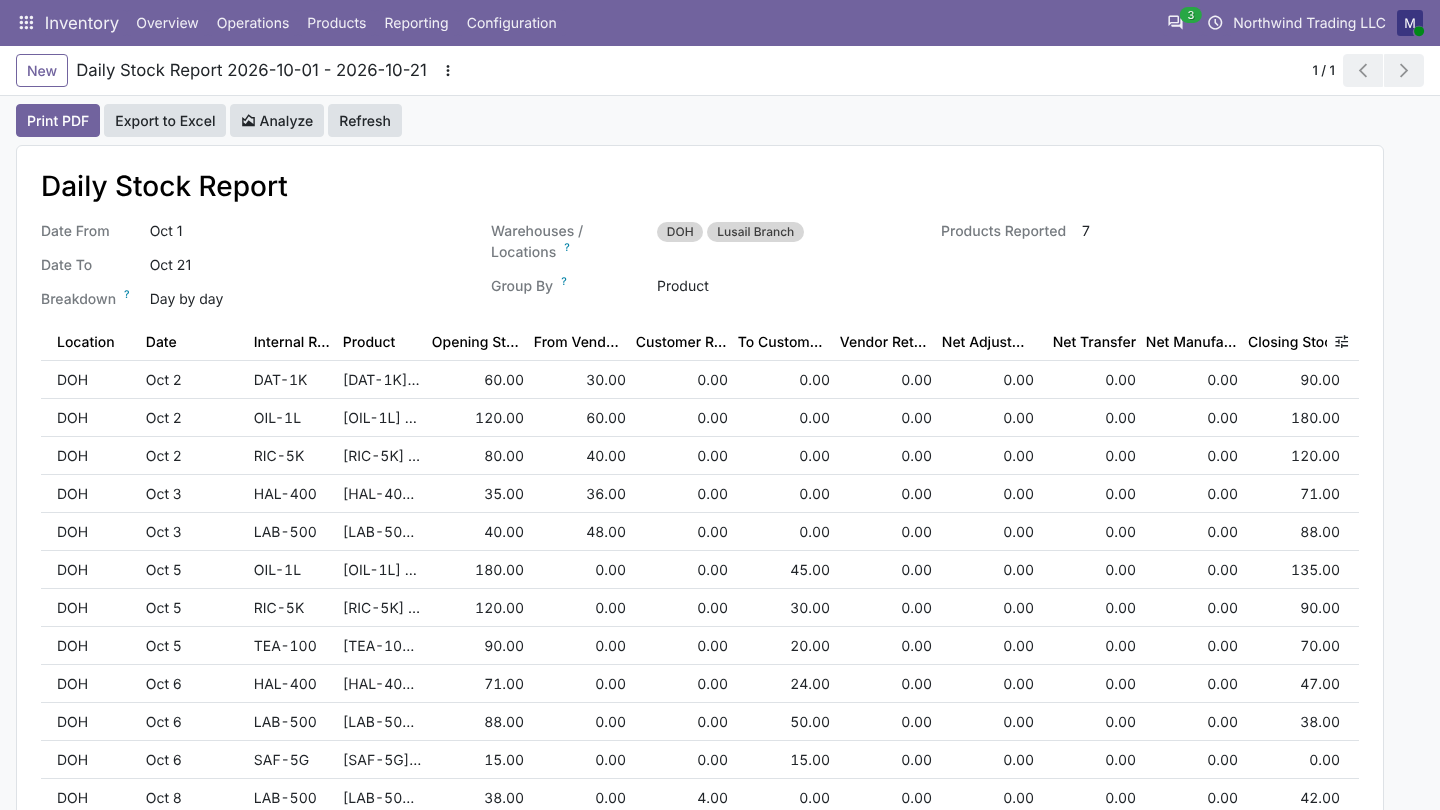
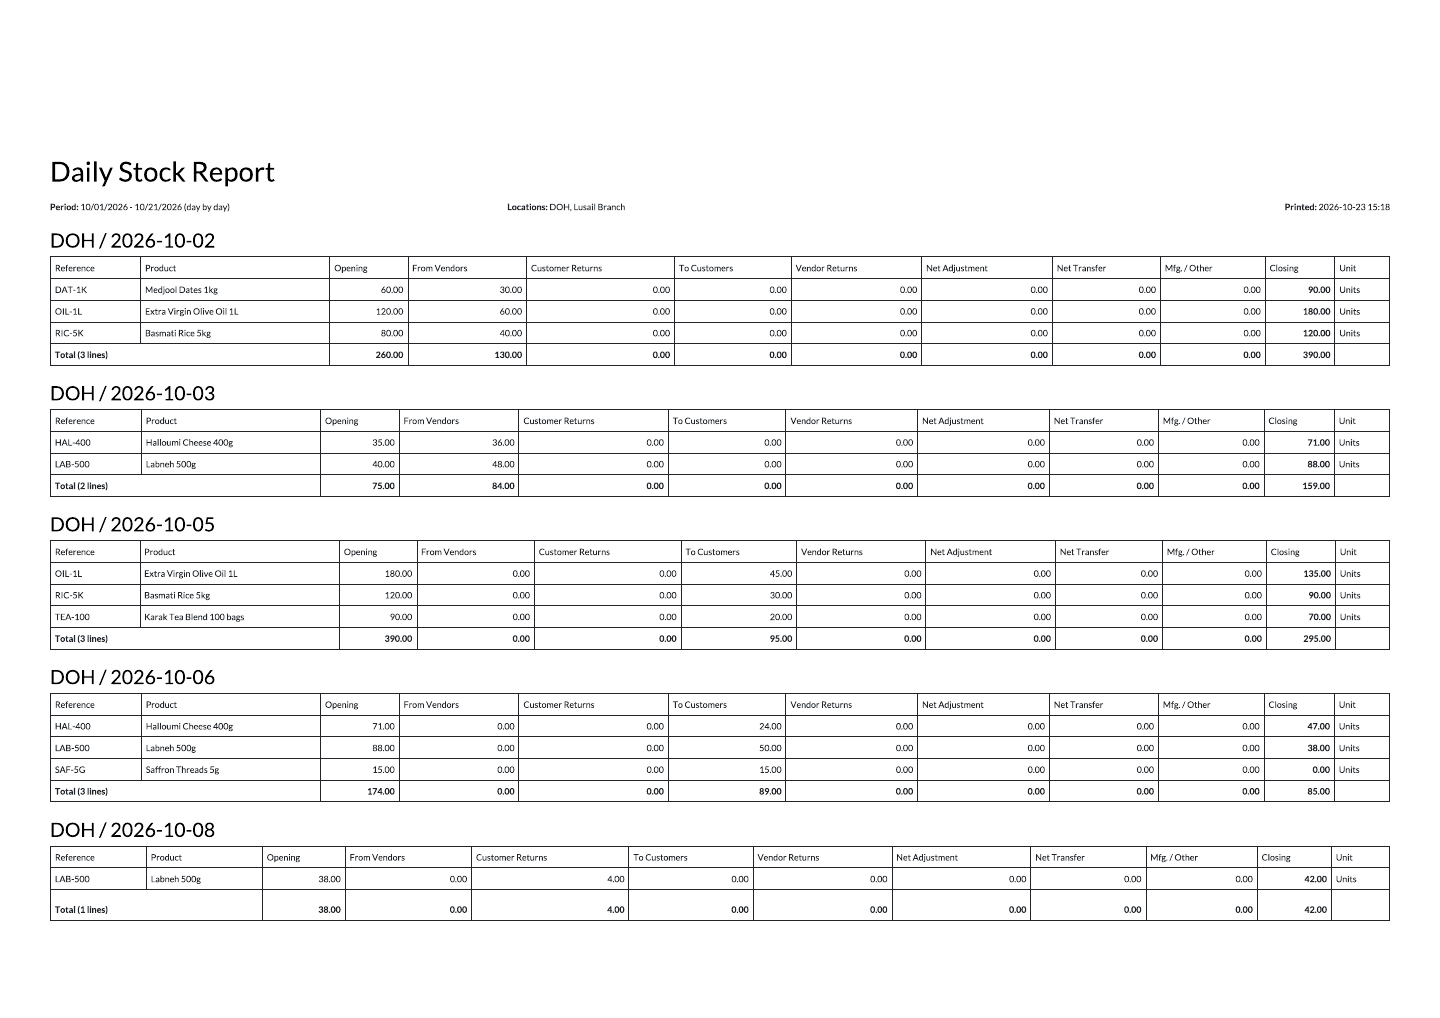
Set Breakdown to Day by day: every product gets one line per day with movement, each with its own opening and closing, for up to 92 days at a time. Each day's closing is the next day's opening. Several warehouses or locations can be shown side by side.
Group and analyze
- Group By product, product category or location sets the subtotals in the PDF and Excel files.
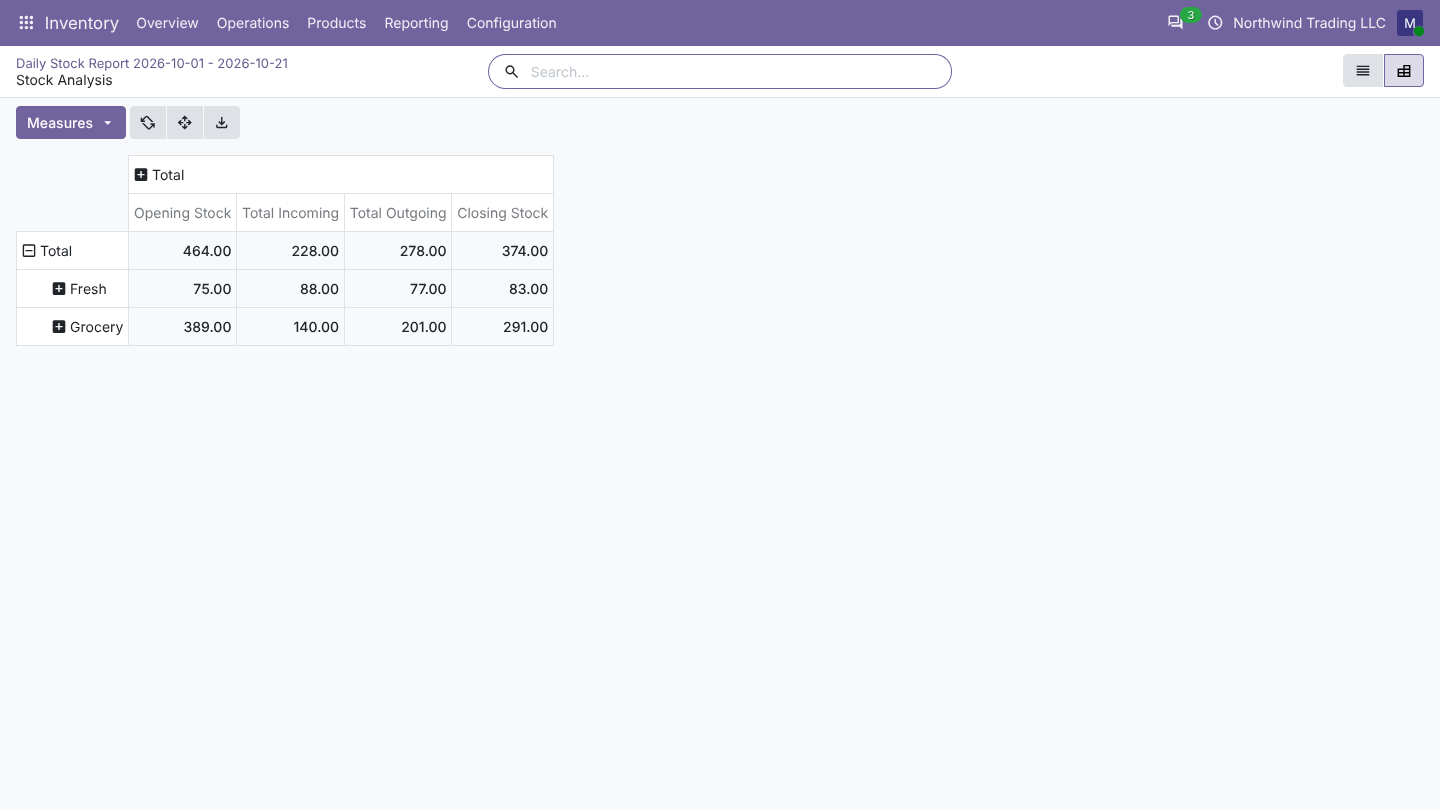
- Analyze opens the same figures as a list and a pivot table you can slice and export.
- Filters show fast, slow and non-moving products for the period.
Stock Ledger
Open Inventory > Reporting > Stock Ledger, choose a product and the period. You see the opening balance, then every receipt, delivery, return, adjustment and transfer with date, partner, document, lot, locations, user and the balance after it.
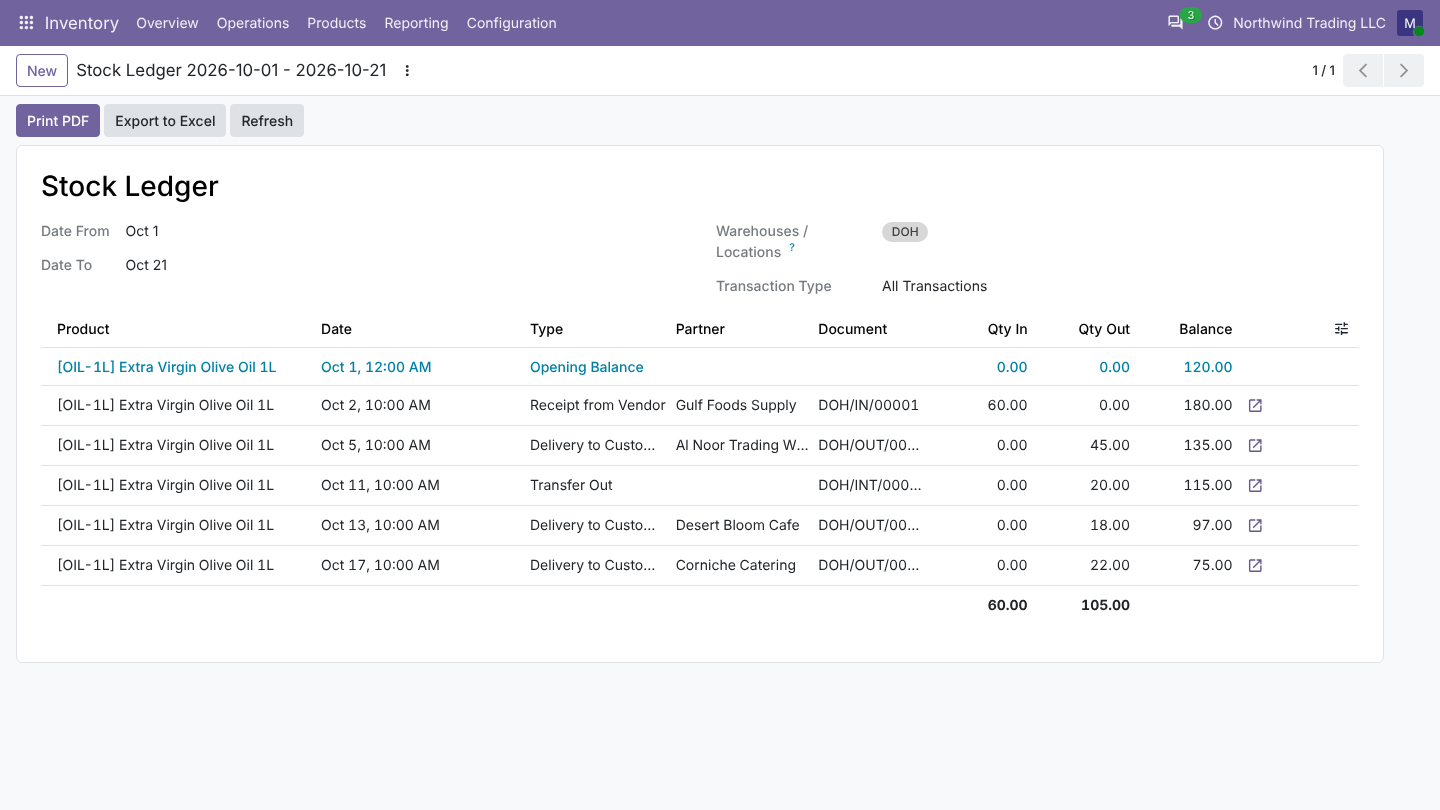
- Click a line to open the transfer, scrap or manufacturing order.
- Filter by partner or type: balances still count every move.
- Filter by lot or serial number for lot-level balances.
- Negative opening stock is shown, never hidden.
PDF and Excel
Both reports print as landscape PDF on your company letterhead and export to Excel with frozen headers, number formats, groups and totals.