Using Dashboard Builder
Tiles
A tile shows one number: a count, sum, average, minimum or maximum.
- Compare with previous period: when the dashboard has a period (for example This month), the tile shows the change against the period before, in green or red.
- Target: shows a progress bar towards a goal, for example a revenue target.
- Icon and Color: pick a Font Awesome icon such as
fa-moneyand a colour. On Odoo 20.0 you can also type a Material Symbols name such aspayments.
Click a tile to open the records behind it.
Charts
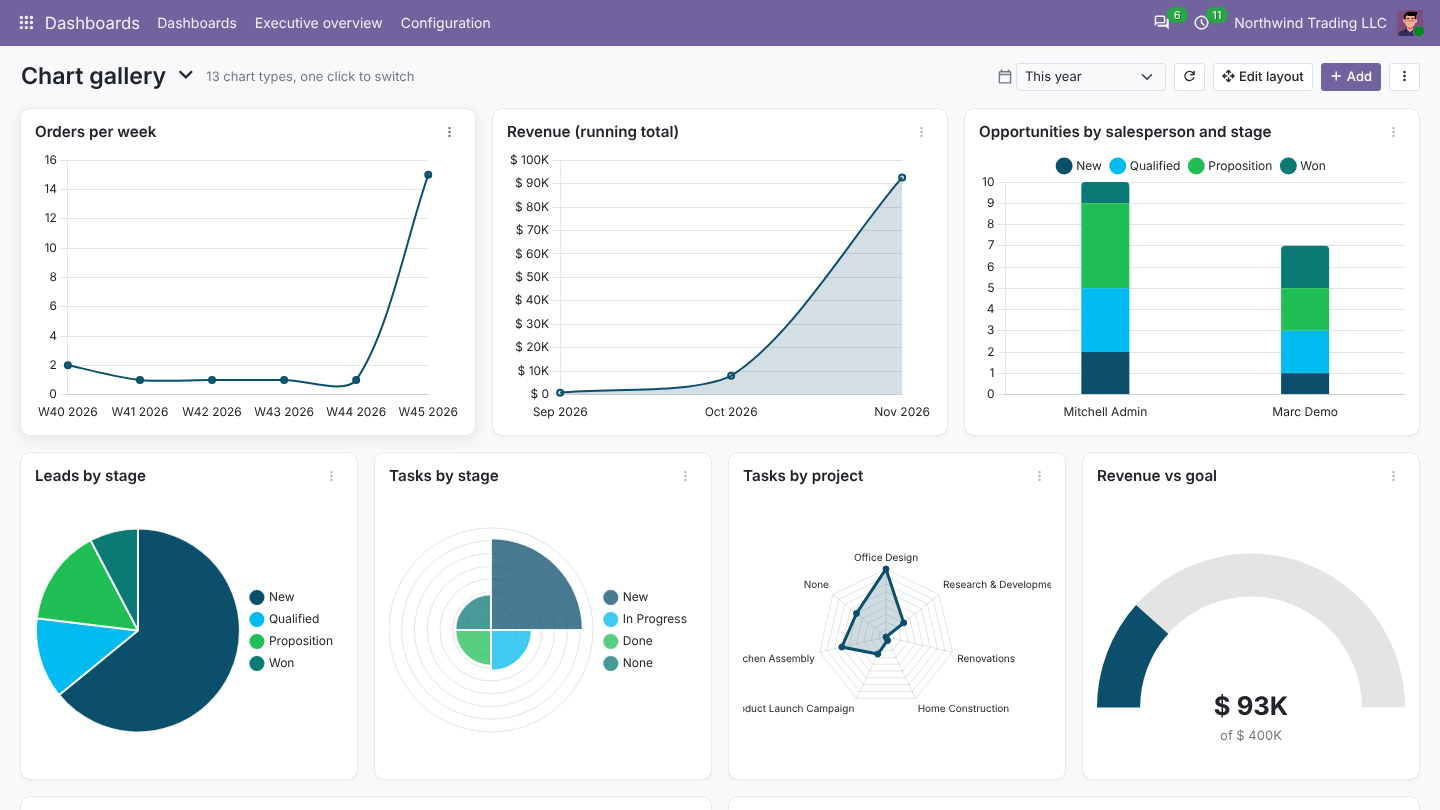
| Type | Good for |
|---|---|
| Bar, horizontal bar | Comparing values: revenue by salesperson, top customers |
| Stacked bar | Totals split by a second field: opportunities by salesperson and stage |
| Line, area | Trends over time; tick Cumulative for a running total |
| Pie, doughnut, polar area | Shares of a whole |
| Radar | Comparing a few categories at once |
| Scatter | Two measures against each other, for example revenue against number of orders per customer |
| Funnel | Stages in order, such as the CRM pipeline |
| Gauge | One value against a target |
Setting up a chart
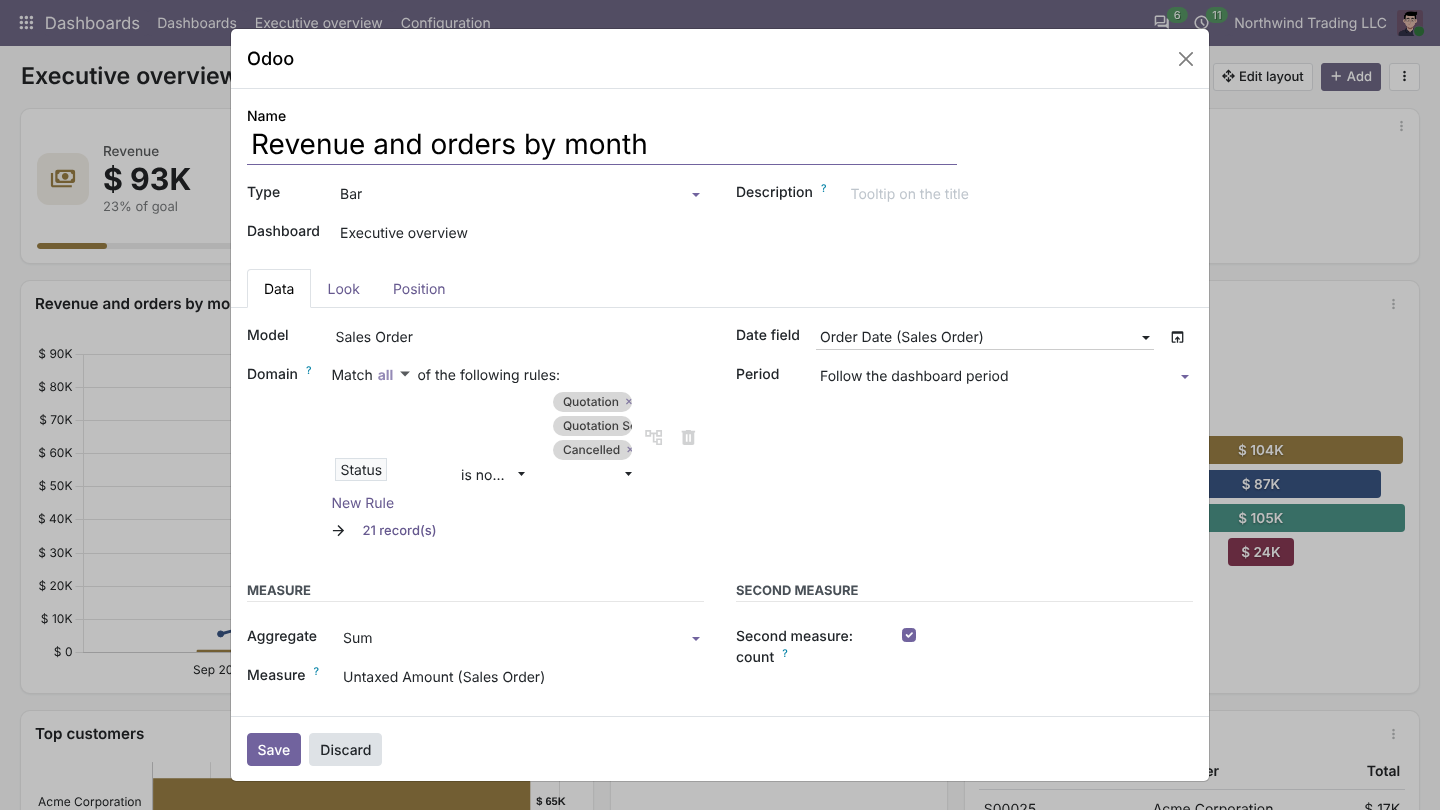
On the Data tab:
- Model: where the data comes from, for example Sales Order or Invoice. Any model works, including your own.
- Filter: which records count, with Odoo's usual filter editor. Two shortcuts work in filters:
%UIDfor the current user and%MYCOMPANYfor the current company. Example:[('user_id', '=', %UID)]shows each person their own figures. - Date field and Period: which date the dashboard period applies to. Choose Own period to fix an item to, say, This year whatever the dashboard shows, or All time to ignore dates.
- Measure: count, or sum, average, minimum or maximum of a number field.
- Second measure: shown as a line with its own axis on bar charts, for example revenue as bars and number of orders as a line.
- Group by: the field along the axis. Dates group by day, week, month, quarter or year.
- Then by (series): splits each bar by a second field.
- Sort and limit: largest first, top 10, and Group the rest as Others.
On the Look tab: prefix and suffix, the currency symbol, short numbers (1.2K, 3.4M), decimals, values on the chart, legend, colours and what a click does.
Lists
A list shows either Records (for example the latest 10 orders, with the columns you choose and their order) or Grouped totals (a table version of a chart). Click a row to open it.
The period filter
The calendar box at the top changes the period of every item that follows the dashboard: today, this week, this month, this quarter, this year, the same for last and next, month to date, quarter to date, year to date, the last 7, 30, 90 or 365 days, the next 7 or 30 days, or a Custom range. The choice is remembered while your browser tab is open.
The item menu
Every item has a ⋮ menu:
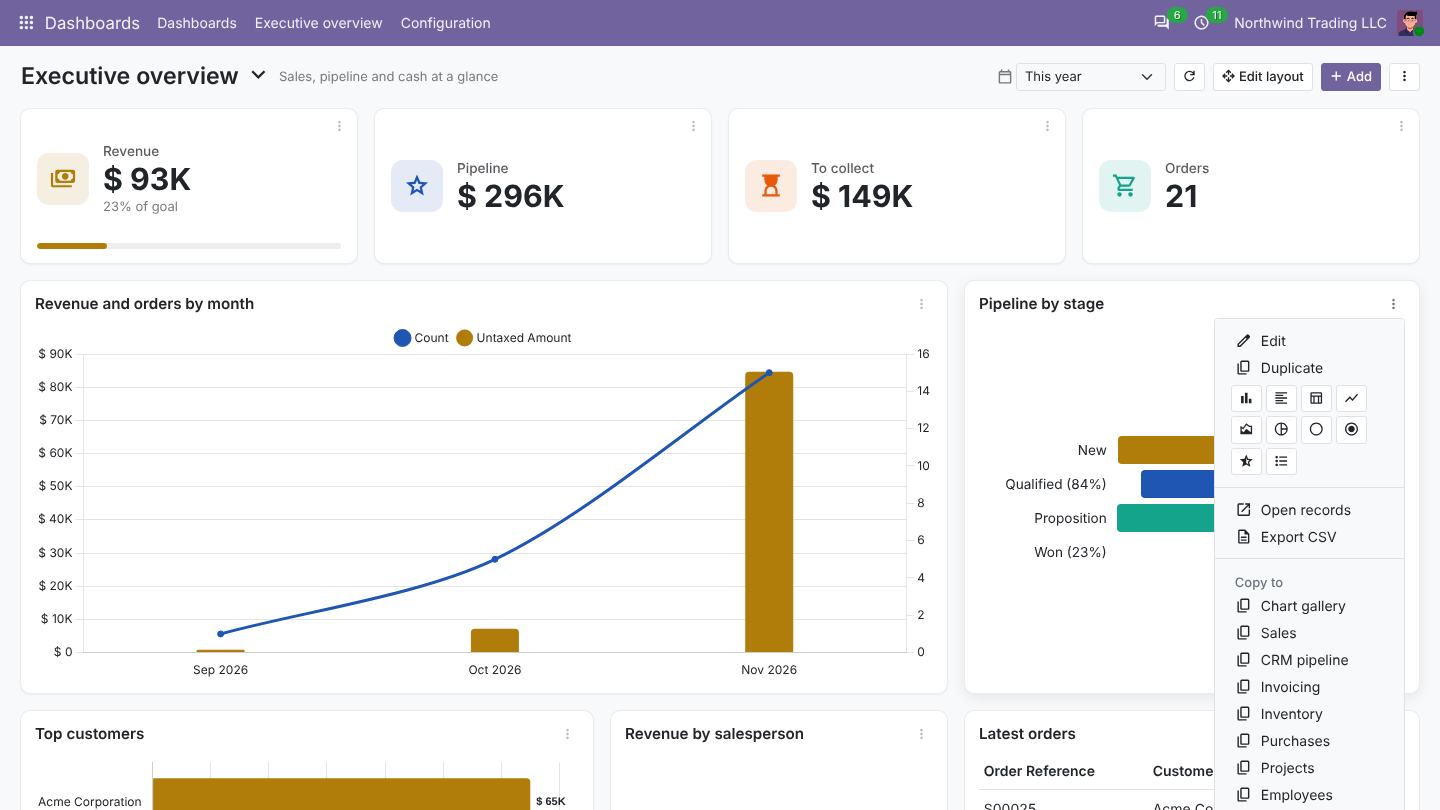
- Edit and Duplicate.
- The row of icons switches the chart type in one click, keeping the data.
- Open records opens the list behind the item.
- Export CSV and Export image (PNG).
- Copy to and Move to another dashboard.
- Delete.
Clicking a bar, slice or point opens exactly the records behind it.
Layout
Click Edit layout. Drag items by their title and resize them from the bottom right corner. Other items move out of the way and the layout is saved as soon as you let go. Click Done when finished.
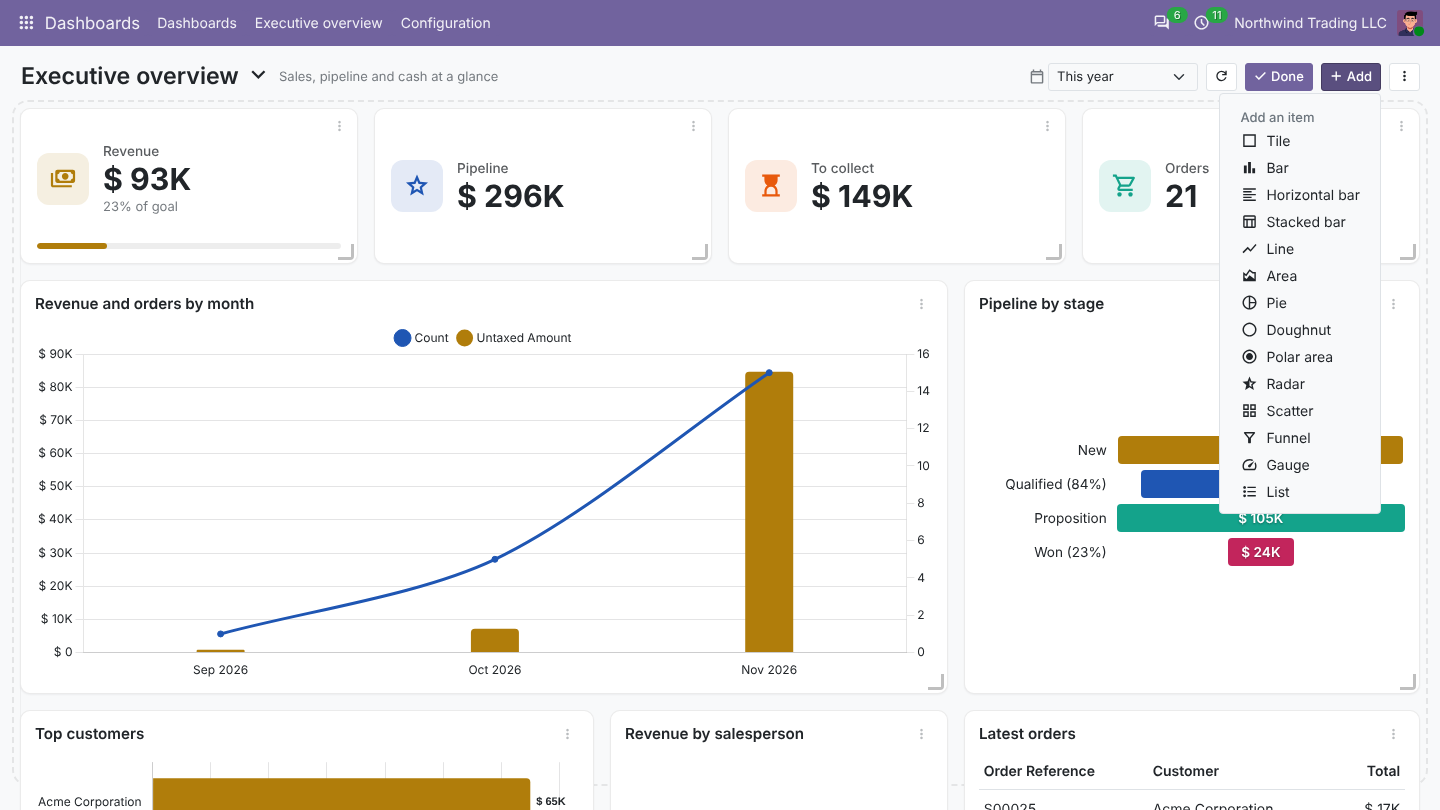
The grid has 12 columns. On a phone, items are shown one under the other.
Refresh, print and export
- The refresh button reloads every item. Auto refresh in the dashboard settings does it on a timer.
- ⋮ > Print prints the dashboard, or saves it as a PDF from the print window.