Pro features
Dashboard Builder Pro ($299, one-time) installs on top of the free app; every dashboard you built stays. Get it on the Apps Store.
Ready-made dashboards
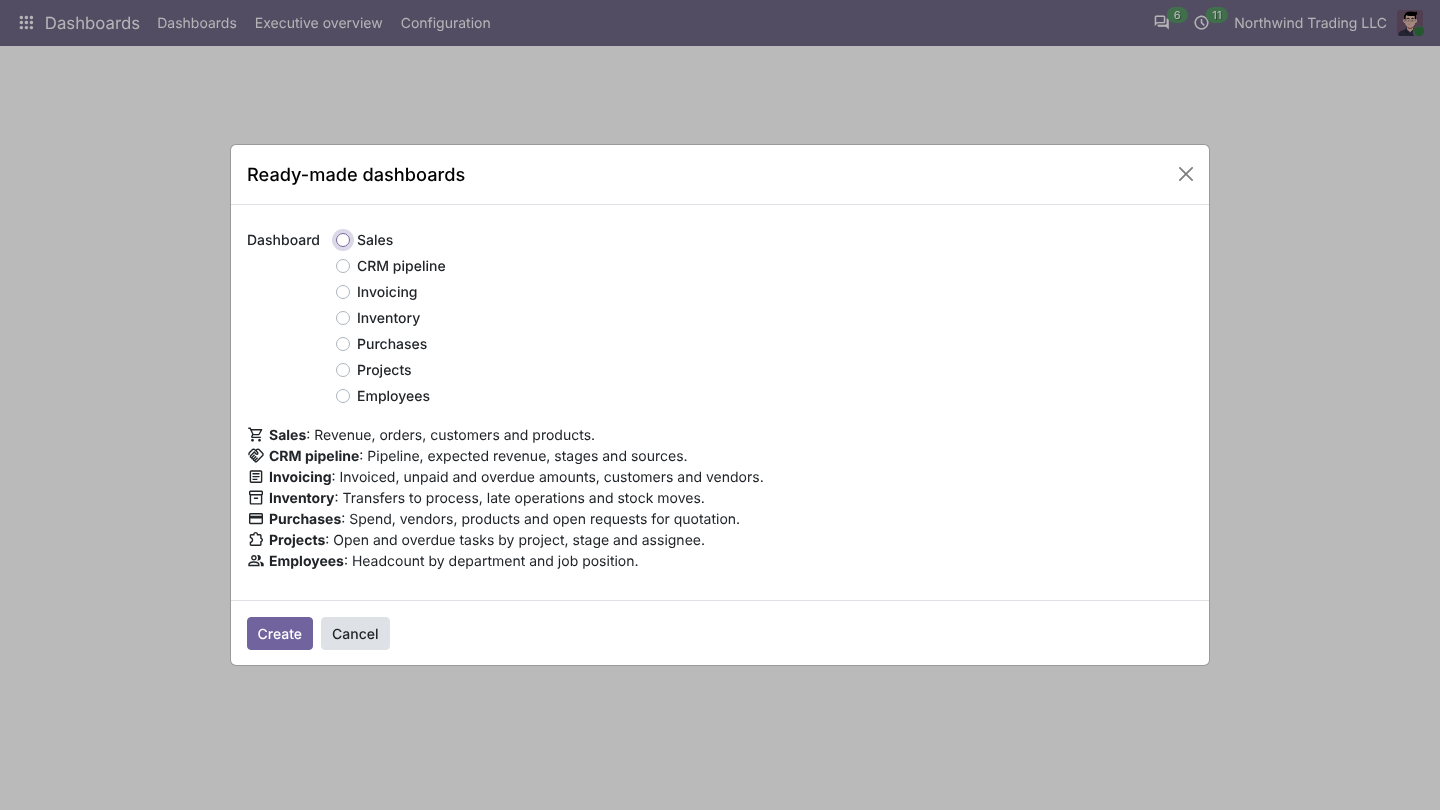
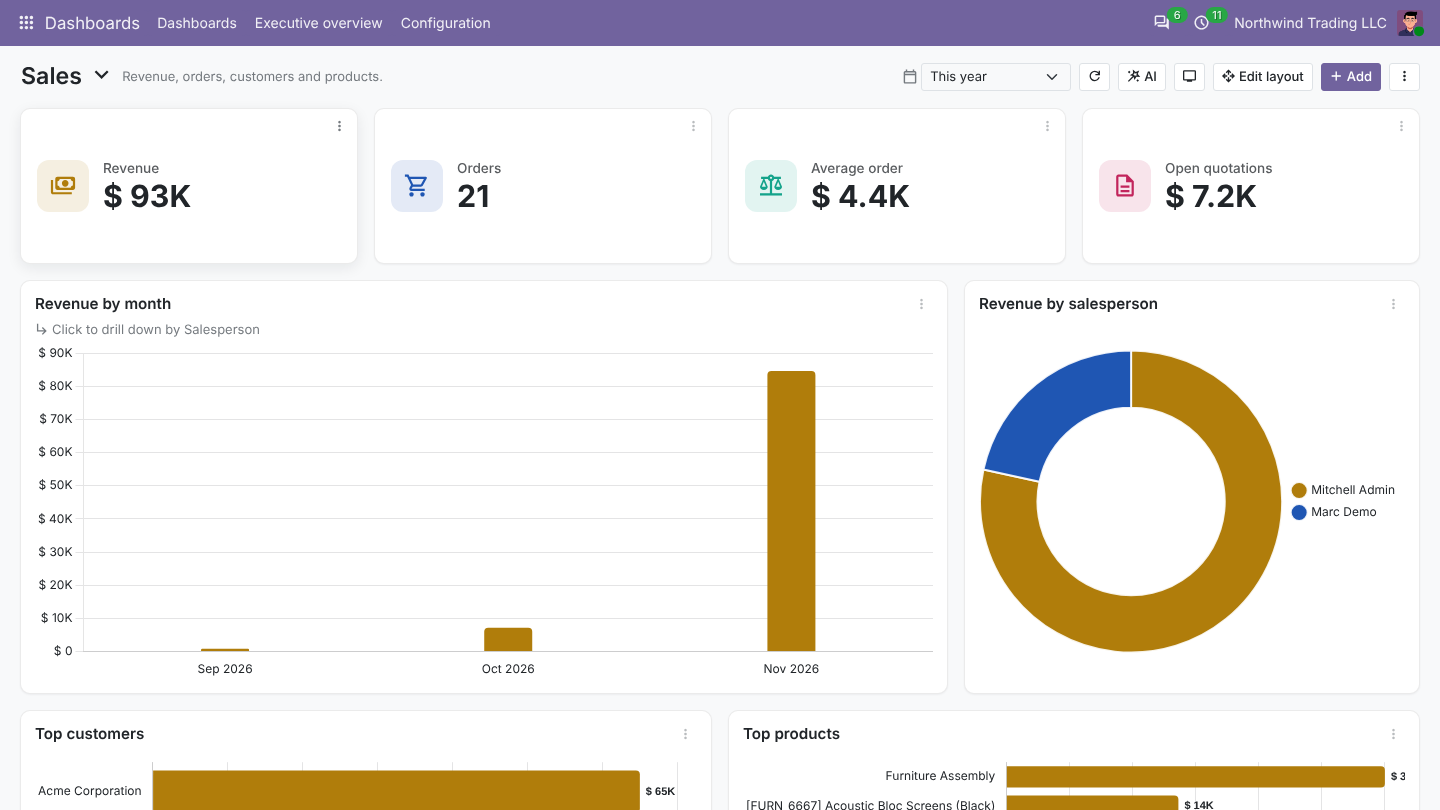
Configuration > Ready-made dashboards (or ⋮ > Ready-made dashboards) offers dashboards for the apps you have installed: Sales, CRM pipeline, Invoicing, Inventory, Purchases, Projects and Employees. Pick one and click Create. It is yours to change like any other.
AI
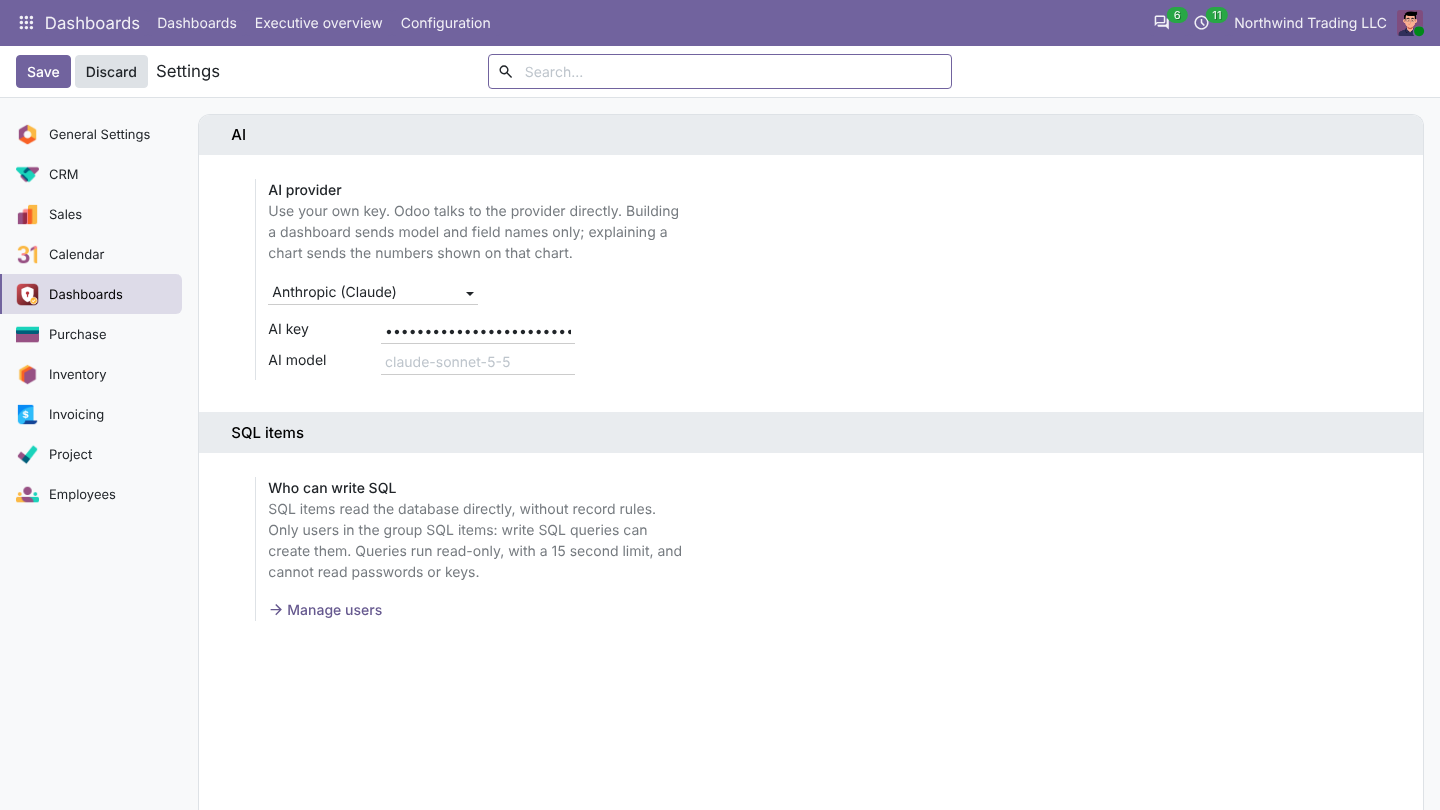
Pro works with your own AI account: Anthropic (Claude), OpenAI, or any service with an OpenAI compatible API (Azure OpenAI, OpenRouter, a local model). Odoo calls the provider directly with your key; nothing goes through Novator.
Connect your AI
- Dashboards > Configuration > Settings, section AI.
- Choose the AI provider and paste your AI key.
- Optional: the AI model (empty uses a current default) and, for OpenAI compatible services, the API address.
Build a dashboard from a sentence
Click AI at the top of a dashboard, describe what you want, and choose New dashboard or Add to the current one.
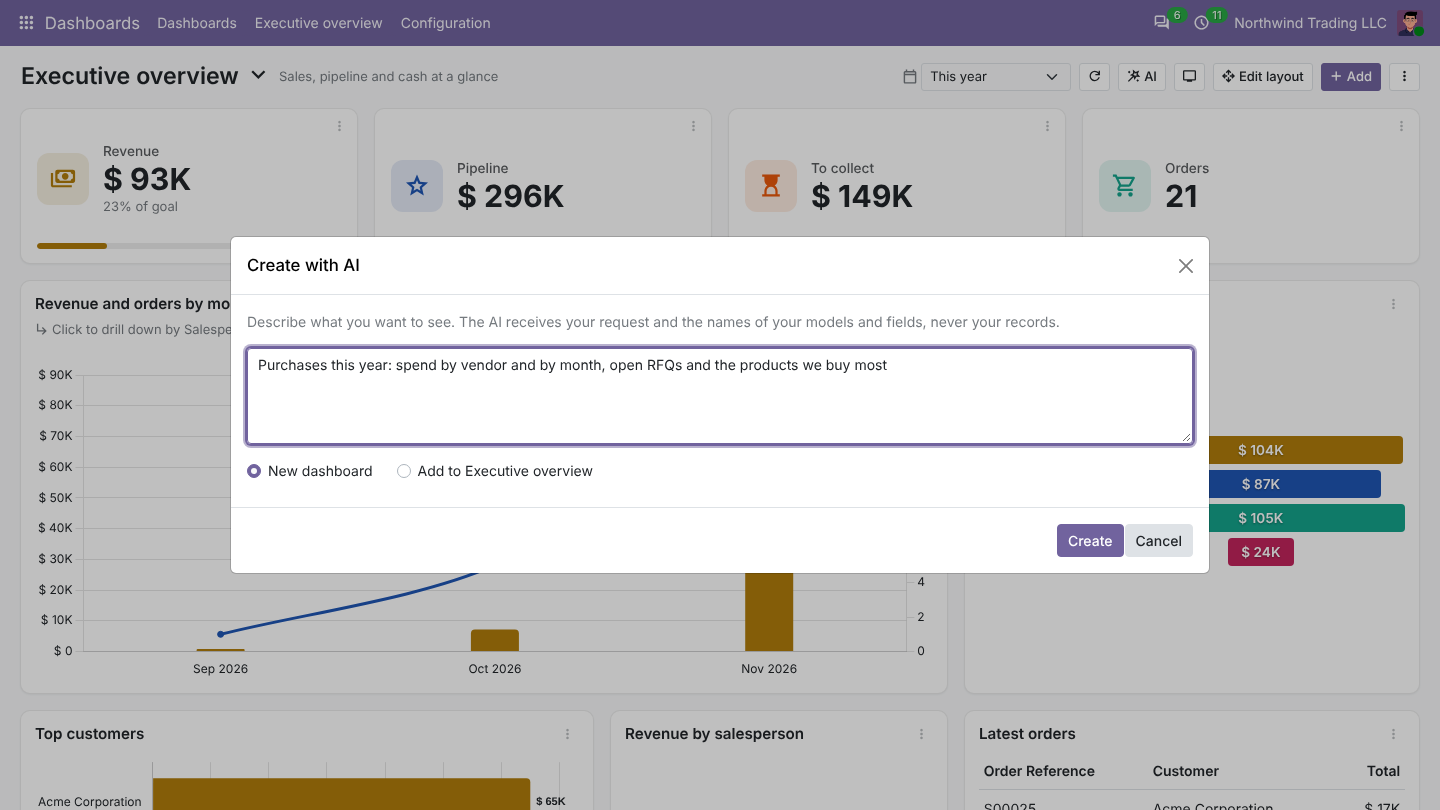
The AI picks the models and fields and proposes tiles and charts. Anything that does not fit your database is skipped and listed. Adjust the result like any dashboard.
What is sent: your request and the names and types of models and fields. Never your records.
Explain a chart
On any item, ⋮ > Explain with AI gives three to five short points: the main trend, the biggest contributors, anything unusual and one suggestion, in your language.
What is sent: the item's title and the numbers shown on it.
Drill-down
Open a chart's settings, tab Drill-down, and add levels, for example Salesperson then Customer. A click on a bar now shows that bar by the next level, with a breadcrumb to go back up. At the last level, a click opens the records.
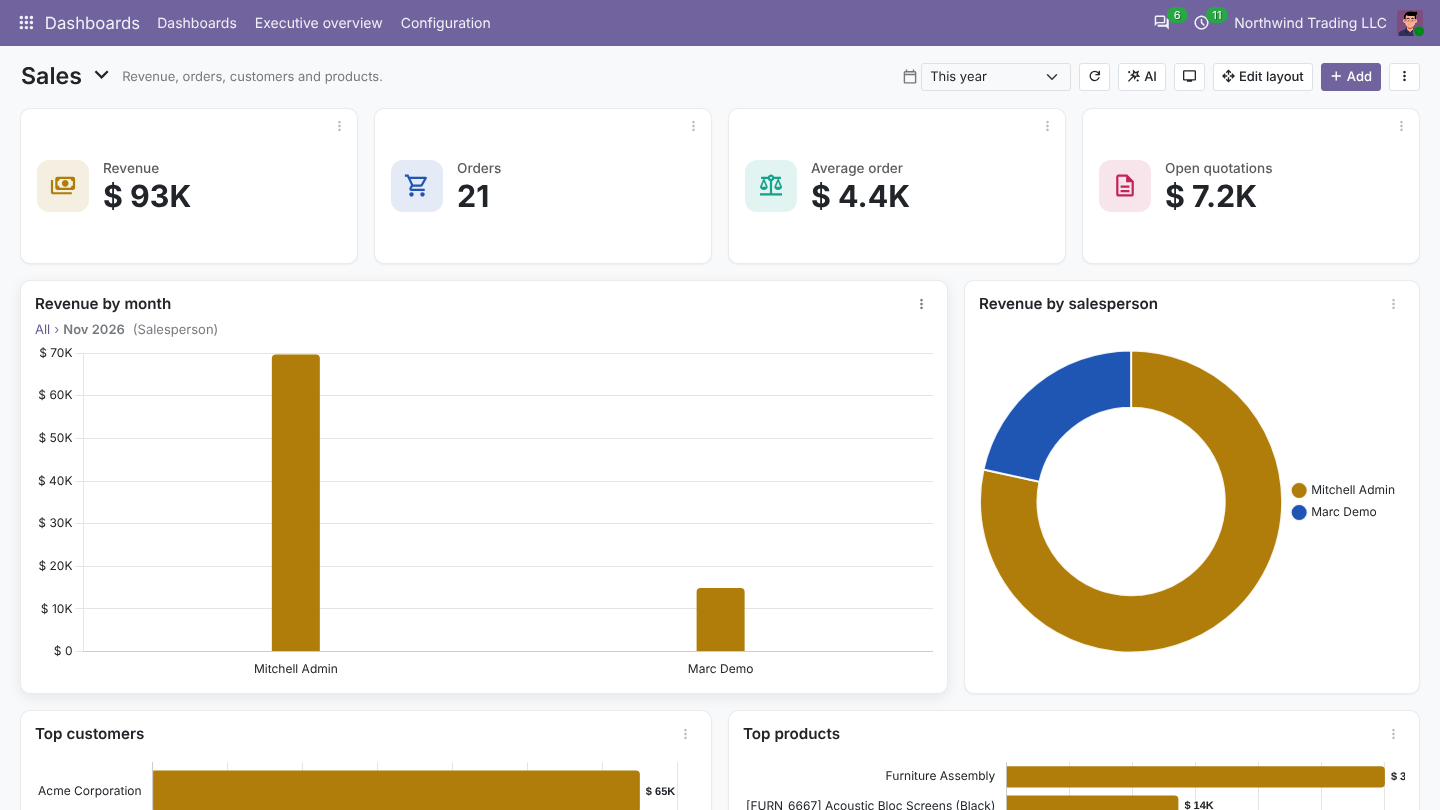
Drill-down works on bar, line, area, pie, doughnut, polar area, radar and funnel charts and on grouped lists.
TV mode
Click the screen icon at the top. The dashboard fills the screen without menus and rotates through every dashboard with Show in TV mode ticked, each for its TV mode: seconds on screen (both in the dashboard settings). Figures are fresh at every turn.
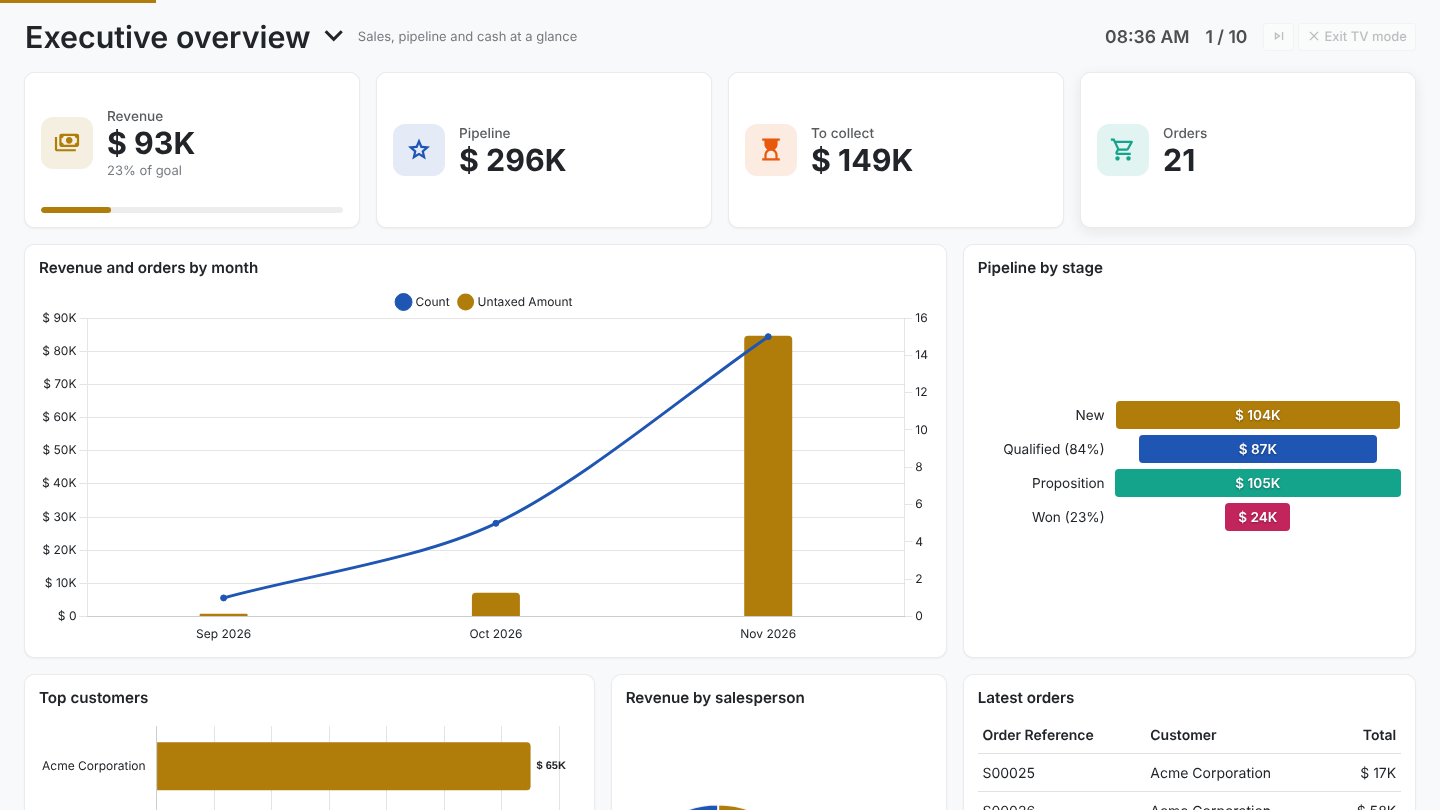
Right arrow skips to the next dashboard; Escape leaves TV mode.
SQL items
For figures that need several tables at once. Only members of SQL items: write SQL queries (Settings > Users, section Dashboards) can create them; nobody is in that group by default.
- Add an item, set Source to SQL query.
- Write a
SELECT: first column the labels, next columns the values. - Use placeholders for the period and the user:
%(date_from)s,%(date_to)s,%(uid)s,%(company_id)s,%(company_ids)s. Write%%for a literal percent sign.
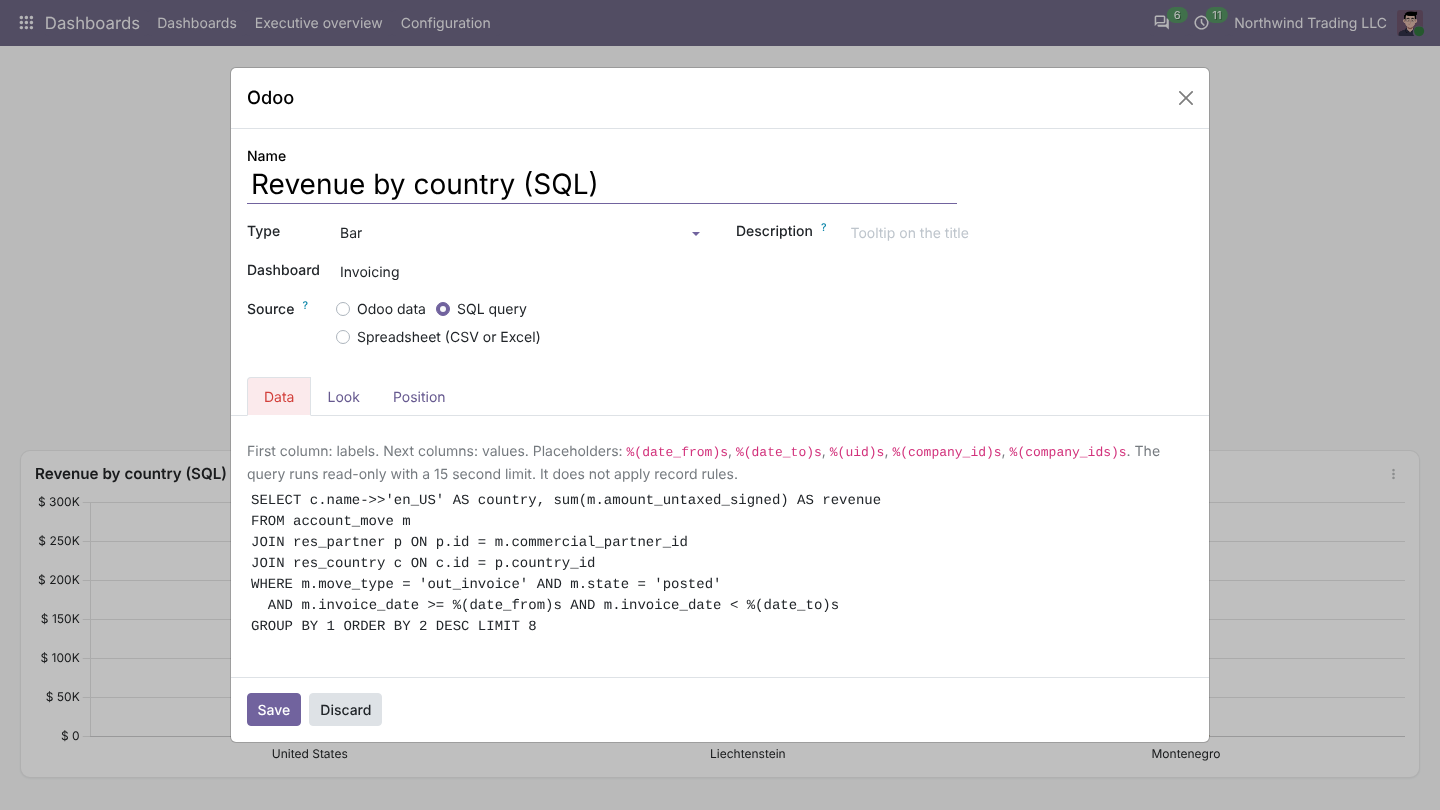
Queries run read-only with a 15 second limit and return at most 500 rows. Queries that read passwords, keys or tokens are refused. SQL items do not apply record rules: everyone who can see the dashboard sees the result.
Spreadsheet items
Set Source to Spreadsheet (CSV or Excel) and upload a file: first row the column titles, first column the labels, next columns numbers. Upload a new file to update the item. Excel files need the Python package openpyxl on the server; CSV always works.
Email digests
Open a dashboard's menu > Email digest, or Configuration > Email digests.
- Pick the Recipients, how often (every day, week or month) and the Period.
- Click Send me a test to see it.
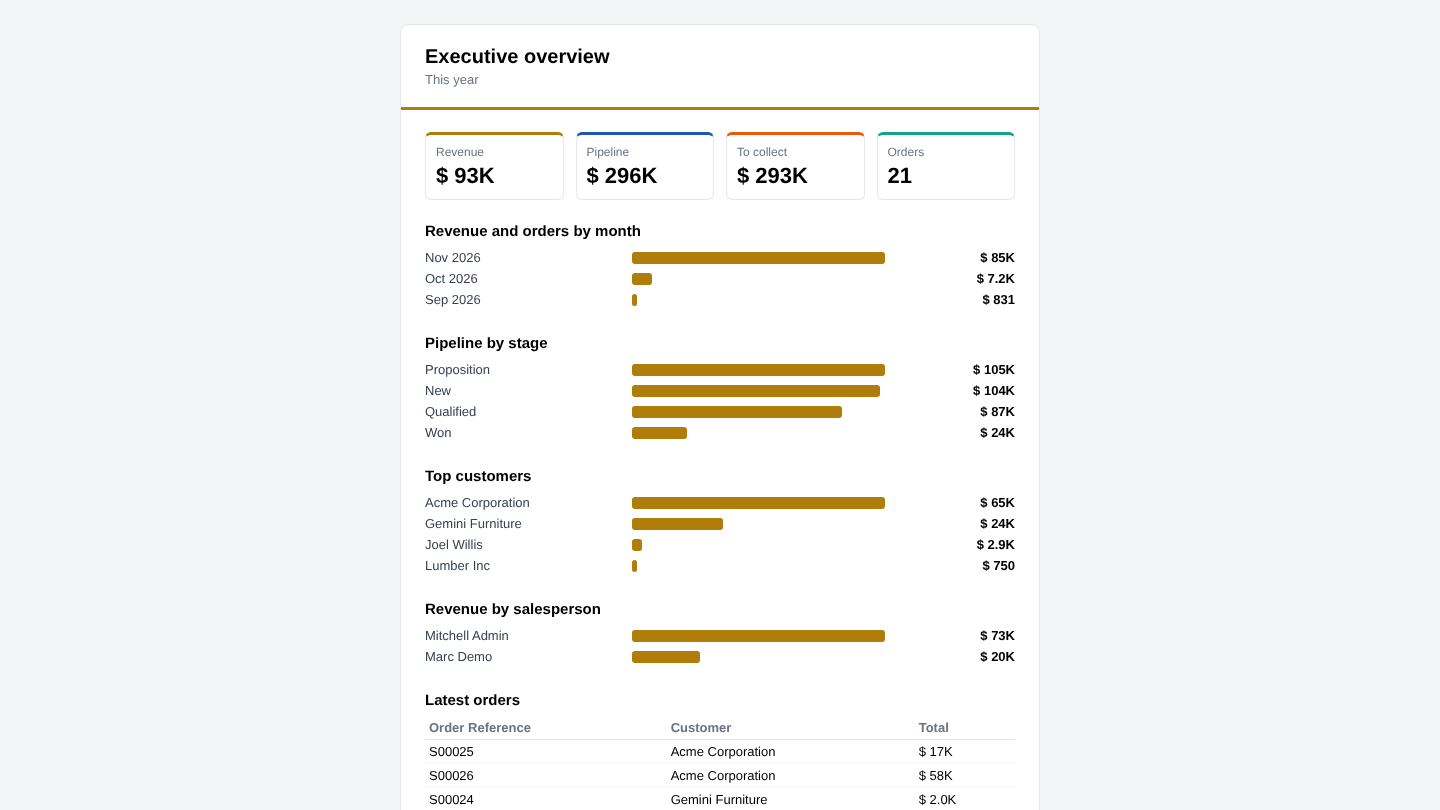
Each recipient gets the figures they are allowed to see: tiles with the change, the top values of each chart, the first rows of each list and a button to open the dashboard.
Export and import
- ⋮ > Export this dashboard downloads a file.
- ⋮ > Import dashboards (or Configuration > Export / import) creates dashboards from such files.
Files use model and field names, not database IDs, so they work on another database with the same apps: build on a test copy, then import in production.